Getting Started#
Plugin Test Environment#
The simplest way to play around with Mosaic Plot is to use the docker-compose plugin test environment
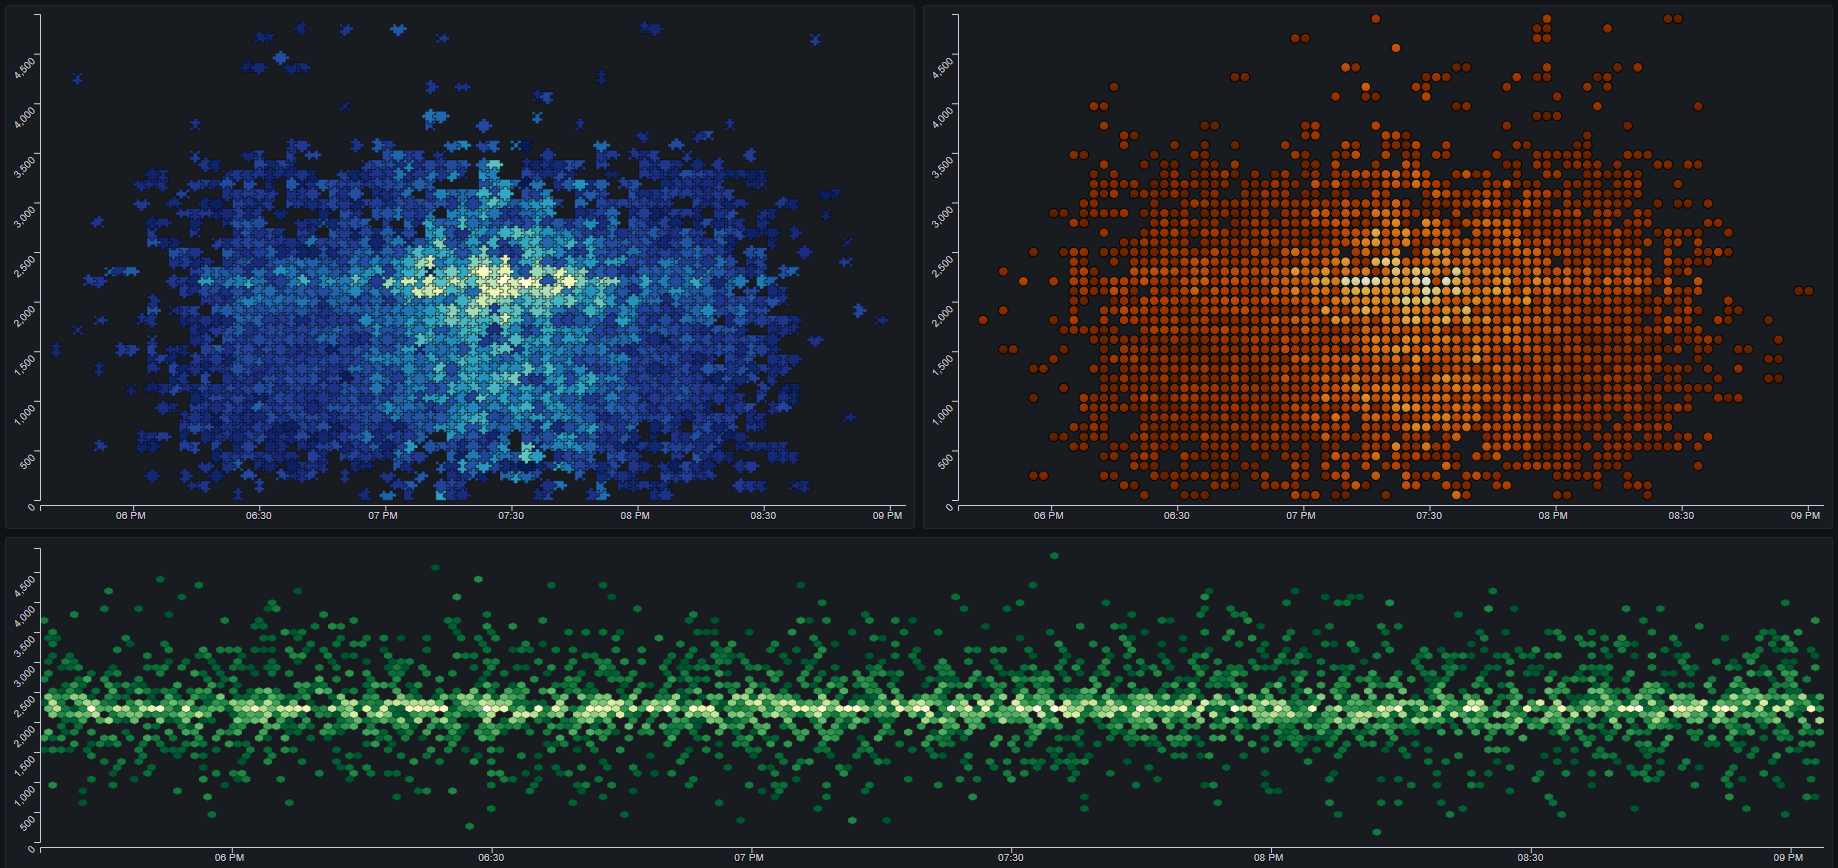
Docker compose will run a container with a Grafana instance (on port 3000) that has the Mosaic Plot plugin installed, along with a number of sample dashboards
Example Dashboards#
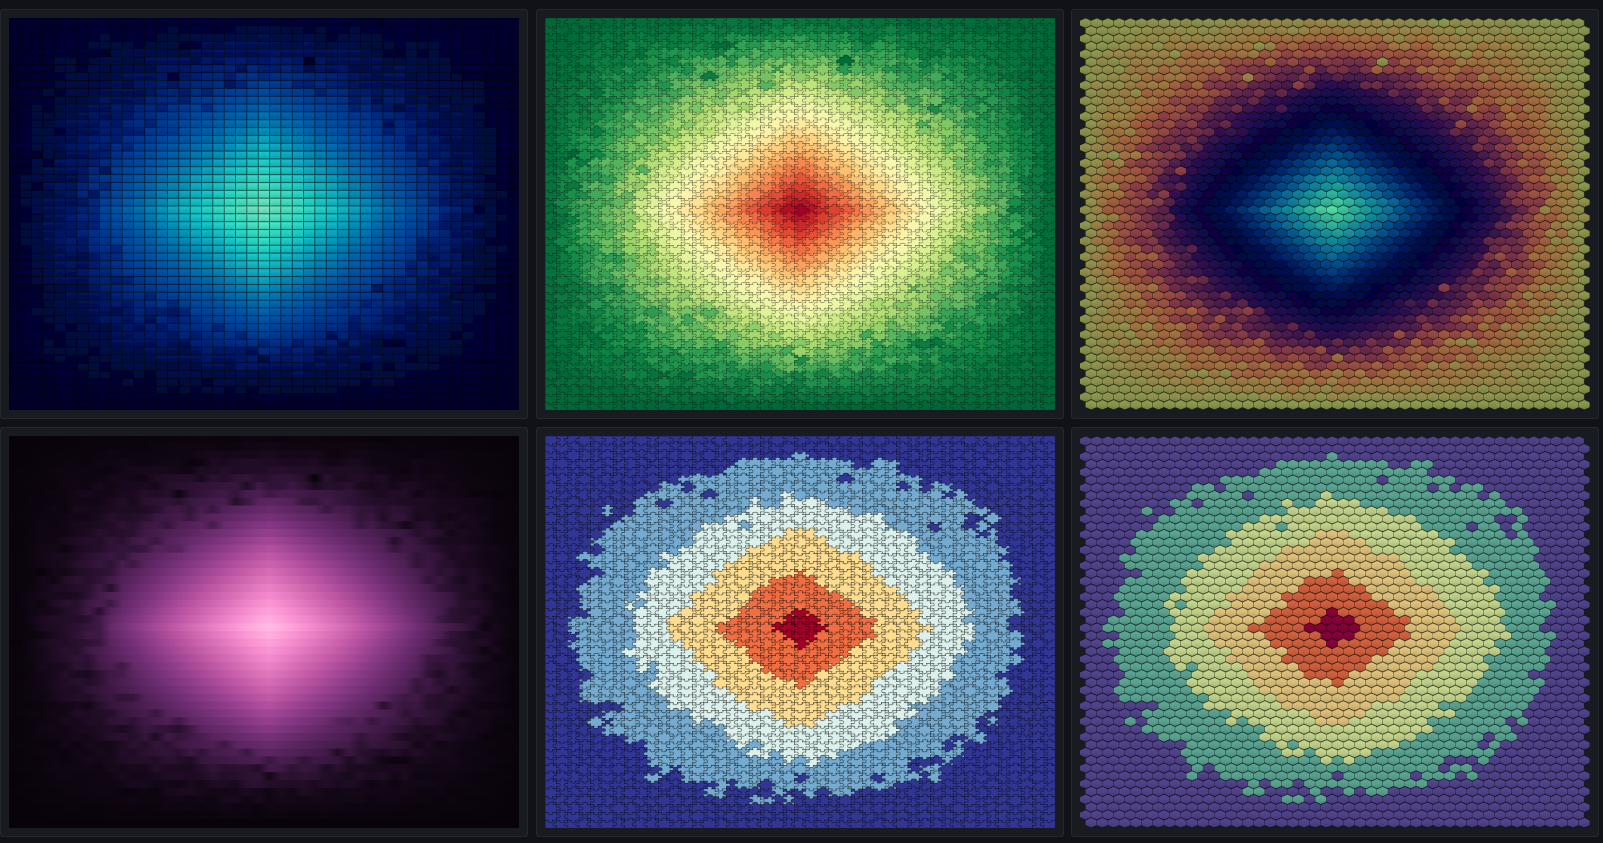
If Mosaic Plot is already installed in your Grafana instance, you can play around with it by using the following dashboards (create a new dashboard and then just copy the JSON contents into the JSON Model)
Hint
The dashboards are self contained (no external data required). They all use the standard TestData DB datasource with static content


